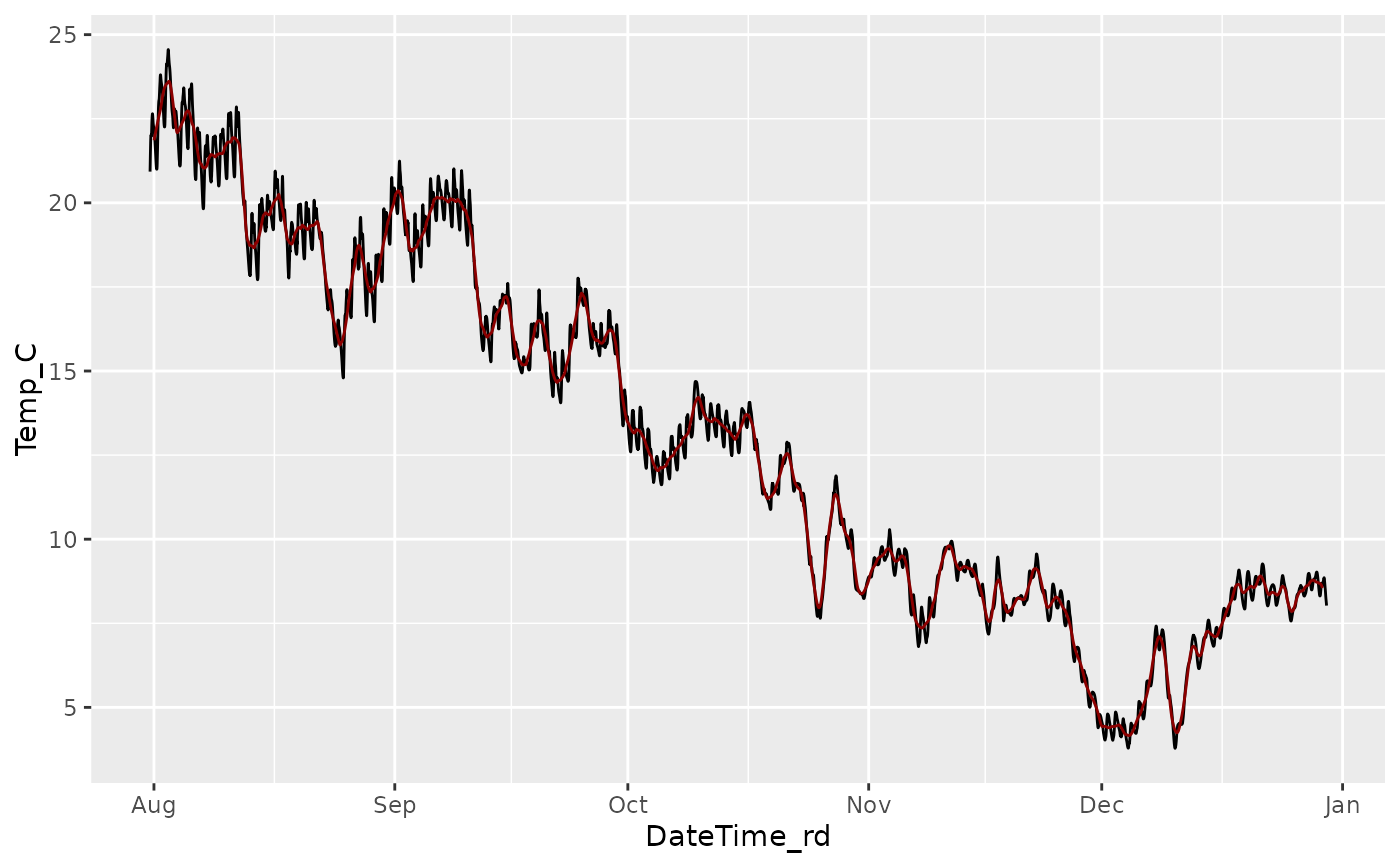
Applies the selected smoothing method to the specified data range.
Arguments
- data
A
data.framewith the data to smooth (must have the columns Index and y_var)- y_var
Character specifying the variable to apply smoothing to.
- method
Character specifying the method to use for smoothing. Options include "rollmean", "rollmedian", "savgol", and "kalman". See details for details on the different methods.
- index
Index values of the rows that need to be smoothed
- k
A adjustment parameter for the selected method (see details).
Details
The following smoothing methods are currently supported:
rollmean: Based on the
rollmeanfunction from thezoopackage. Replaces data with a rolling mean value. Thekparameter is used to control the number of points to include in the mean calculation.rollmedian: Based on the
rollmedianfunction from thezoopackage. Replaces data with a rolling median value. Thekparameter is used to control the number of points to include in the median calculation, should be odd but will convert to an odd number with a warning.savgol: Based on the
savgolfunction from thepracmapackage. Applies a Savitzky–Golay filter which fits a fourth order polynomial to a sliding range of data. Thekparameter is used controls the number of points in the window.savgol: Based on the
dlmSmoothfunction from thedlmpackage. Applies a Kalman filter which process model to the data. Thekparameter is used controls the amount of smoothing.